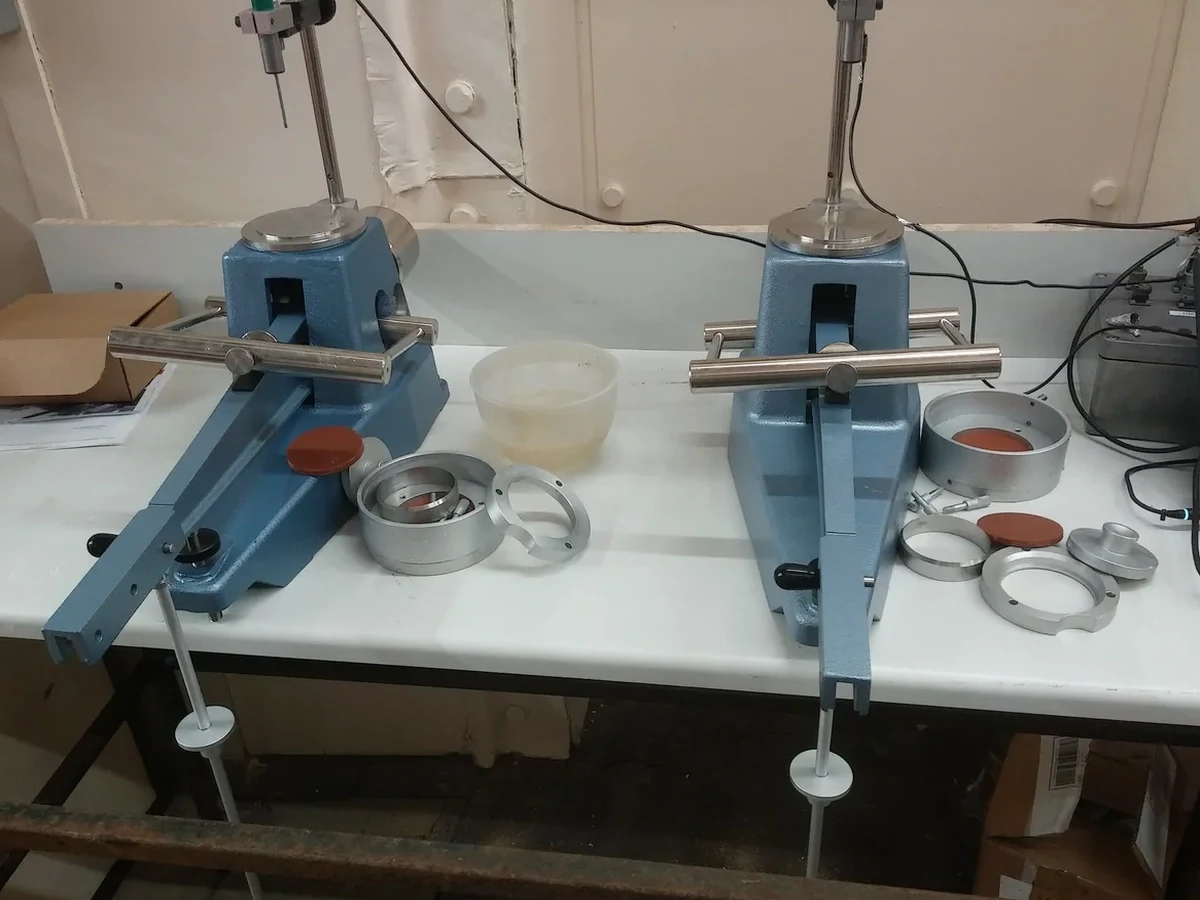
ASTM D4318 governs the determination of liquid limit, plastic limit, and plasticity index—collectively known as the Atterberg limits—and in Oxnard these parameters carry weight beyond a routine index test. Much of the city sits on the Oxnard Plain, a broad alluvial basin where the Santa Clara River has deposited layers of silty clay, clayey silt, and occasional lenses of organic material over thousands of years. The 2022 California Building Code (CBC), based on IBC, ties foundation type and depth directly to soil expansion potential, and that potential is quantified through the plasticity index. A plasticity index above 15, common in the montmorillonitic clays mapped in pockets near the old river channels around the Oxnard Historic District, flags an expansive soil that can lift a slab or heave a footing if moisture content changes seasonally. When we run the Casagrande cup and the plastic limit thread-rolling procedure in our ISO/IEC 17025-accredited lab, the resulting numbers feed directly into the Unified Soil Classification System (USCS) and determine whether the soil is CL, CH, or MH—a distinction that dictates everything from allowable bearing pressure to the need for a mat foundation design. For sites within the liquefaction hazard zones identified by the California Geological Survey, the liquid limit also serves as a screening parameter: soils with a liquid limit below 30 and a plasticity index below 10 are more susceptible to rapid pore-pressure buildup, which is why the Atterberg suite often runs in parallel with a liquefaction assessment on deeper borings across the Oxnard Plain.
A plasticity index above 15 in Oxnard's alluvial clays triggers expansive soil provisions under CBC Section 1803.5.3, directly influencing foundation depth and reinforcement requirements.
Local geotechnical context
The marine influence on Oxnard's climate—mild, with a marked dry season from May through October and a rainy season that can deliver concentrated downpours—creates a cyclic moisture regime that punishes misclassified soils. During the summer, the upper 3 to 5 feet of clay lose moisture through evapotranspiration, and the resulting shrinkage opens cracks that later serve as conduits for rapid infiltration when the first winter storms arrive. If a geotechnical report relied solely on Atterberg limits from samples taken in September, when the natural moisture content is at its seasonal minimum, the reported plasticity index will be accurate but the in-situ water content will not reflect the worst-case condition for heave. This is why our sampling protocol for Oxnard projects specifies that Atterberg limit determinations be accompanied by a natural moisture content profile, allowing the engineer to plot the liquidity index and assess whether the soil is currently below, at, or above its plastic limit. A liquidity index approaching 1.0 in a CH soil signals a material that can undergo significant volume change with relatively small shifts in moisture, a scenario that has led to slab distress in several Oxnard residential tracts built on former agricultural land where the pre-consolidation pressure from surficial desiccation was inadvertently removed during grading, reactivating the expansive potential of the deeper clay.
Standards that apply
ASTM D4318-17e1: Standard Test Methods for Liquid Limit, Plastic Limit, and Plasticity Index of Soils, ASTM D2487-17e1: Standard Practice for Classification of Soils for Engineering Purposes (Unified Soil Classification System), 2022 California Building Code (CBC) Section 1803.5.3: Expansive Soils, IBC 2021 Section 1803: Geotechnical Investigations, Caltrans Standard Specifications Section 24: Soil and Aggregate Testing
Common questions
What do Atterberg limits tell me about my Oxnard building site that a simple soil description cannot?
A visual-manual description can tell you the soil is a 'silty clay,' but it cannot quantify how that clay will behave when the water content changes. The Atterberg limits provide three numbers—liquid limit, plastic limit, and plasticity index—that together define the range of moisture over which the soil remains plastic and, critically, how much volume change to expect. In Oxnard, where alluvial clays derived from the Santa Clara River watershed often contain smectite-group minerals, a plasticity index above 15 is the threshold that triggers the expansive soil provisions of the California Building Code. The liquid limit alone can also serve as a rough proxy for compressibility: a soil with a liquid limit above 50 (classified as CH, or fat clay) will typically consolidate more under load than a lean clay with a liquid limit of 35. These numerical values allow the structural engineer to select an appropriate foundation type—a stiffened slab, post-tensioned slab, or deepened footings—based on quantifiable risk rather than qualitative judgment.
How are Atterberg limit tests performed, and how long does the laboratory process take?
The procedure follows ASTM D4318 and involves two separate determinations. The liquid limit is measured using a Casagrande cup device: a soil paste is placed in a brass cup, a groove is cut with a standard grooving tool, and the cup is dropped repeatedly until the groove closes over a specified length. The number of blows is plotted against moisture content across at least three trials, and the liquid limit is the moisture content at 25 blows. The plastic limit is determined by hand-rolling threads of soil until they crumble at a diameter of approximately 3 mm, then measuring the moisture content of those threads. The plasticity index is simply the arithmetic difference (LL - PL). From sample preparation to final report, the complete suite typically requires 3 to 5 business days for a set of samples from a single Oxnard boring. Expedited turnaround of 48 hours is available when the project schedule demands it, though oven-dried sample preparation—which can alter the plasticity of some Oxnard clays—is used only when explicitly requested by the project geotechnical engineer.
What is the typical cost for Atterberg limits testing on a residential foundation project in Oxnard?
For a single-family residential investigation in Oxnard, Atterberg limits testing on individual samples typically ranges from US$60 to US$100 per sample when performed as part of a broader laboratory testing package that includes moisture content and grain-size analysis. A complete foundation investigation involving multiple borings with Atterberg limits on selected samples from each boring generally falls between US$600 and US$1,200 for the laboratory portion, depending on the number of samples and the complexity of the classification. Commercial and multi-family projects with more extensive sampling requirements are quoted on a project-specific basis. These figures reflect the laboratory testing component only and do not include the cost of subsurface exploration, which is contracted separately.
Can Atterberg limits predict how much my Oxnard foundation slab will move seasonally?
The Atterberg limits alone cannot predict the magnitude of slab movement in inches or millimeters, but they are the essential input parameter for the empirical correlations that do. The plasticity index, combined with the clay fraction percentage, yields the soil's activity number, which Skempton (1953) defined as PI divided by percent clay. An activity above 1.0 indicates active, potentially expansive clay minerals, while values below 0.75 suggest relatively inert material. For Oxnard sites, we typically apply the swell potential classification system developed by Seed, Woodward, and Lundgren (1962), which uses plasticity index ranges to categorize soils as low (PI < 10), medium (10–20), high (20–35), or very high (PI > 35) expansion potential. These categories correlate with volume changes on the order of 1–10 percent under a surcharge of 1 psi, and the structural engineer uses these ranges to design slab reinforcement, select the appropriate moisture barrier details, and specify the depth of the perimeter footing. For a definitive measurement of swell pressure, a one-dimensional swell-consolidation test (ASTM D4546) on an undisturbed sample is recommended as a follow-up when the plasticity index exceeds 25.