← Home · Laboratory

Precision Grain Size Analysis in Oxnard’s Problematic Soils

Together, we solve the challenges of tomorrow.

LEARN MORE →

We got a call last month from a crew pouring a mat foundation off West Gonzales Road. They had imported fill that was supposed to be a clean sand, but the fines content was way off. The material was heaving under compaction, and the inspector shut the lift down. That is the reality of building in Oxnard—between the wind-blown beach deposits and the deep silty clays from the Santa Clara River plain, you cannot guess gradation. A proper grain size analysis, running from the coarse sieve stack down through hydrometer sedimentation, gives you the exact distribution curve you need to classify the soil per ASTM D2487 and make a call on usability. In a city with a water table barely ten feet down in some zones, silt percentage dictates drainage behavior, and that data goes straight into foundation and pavement design.

In Oxnard, the difference between a well-graded sand and a silty sand is the difference between a passing lift and a rejected one.

Our approach and scope

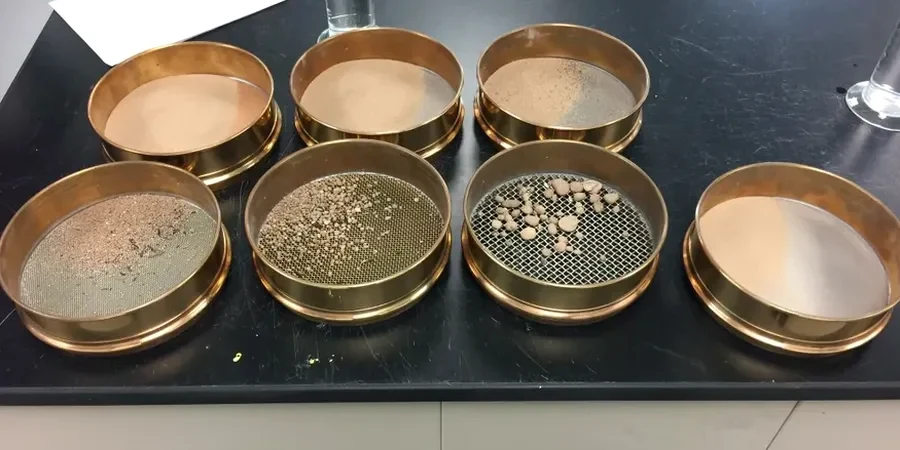
Oxnard sits on the Oxnard Plain, a structural trough filled with Pleistocene alluvium and recent beach deposits. Much of the near-surface material is a mix of fine dune sand and fat clay lenses, and the top three feet are often disturbed by decades of agricultural reworking. Our sieve analysis uses stacked sieves down to the No. 200, and when fines exceed 12 percent we run the full hydrometer test to separate silt from clay. That is critical here because the borderline between an SC and an MH per the Unified Soil Classification System changes everything: seismic site class, lateral earth pressure, and infiltration rate. We run the analysis under ASTM D7928 for the hydrometer phase, with temperature-controlled baths and sodium hexametaphosphate dispersion, avoiding the flocculation errors that plague quick field checks. For projects near the Mandalay Bay area, where the sand fraction is nearly pure silica from old dune systems, the combined curve is what validates liquefaction susceptibility models. When the log shows a gap-graded soil, we flag it immediately and often recommend pairing the gradation data with an Atterberg limits determination to nail down the plasticity characteristics of the fines fraction.
Precision Grain Size Analysis in Oxnard’s Problematic Soils
Technical reference image — Oxnard

Local geotechnical context

Oxnard grew fast after World War II, and a lot of the older commercial strips along Saviers Road were built on fill that nobody characterized properly at the time. We have pulled samples from those redevelopment sites that came back as 40 percent fines—material that looks like sand in the field but is practically a silt by weight. When that fill gets wet during a rainy winter, it loses strength fast. Ignoring gradation in these older infill zones carries a real risk: differential settlement, pavement rutting, and stormwater system clogging from fines migration. The ASCE 7 seismic provisions for the Oxnard Plain push you into Site Class D or E more often than not, and that classification depends directly on the grain size curve and fines content. If your report says sand but the hydrometer says clay, your base isolation design could be off by a full site class.

Need a geotechnical assessment?

Reply within 24h.

Email: info@geotechnicalengineering1.com

Watch the video

Typical values

ParameterTypical value
Sieve range (coarse)3 in through No. 10
Sieve range (fine)No. 16 through No. 200
Hydrometer methodASTM D7928 (151H/152H)
Minimum sample mass200 g (sands), 500 g (gravelly)
Dispersing agentSodium hexametaphosphate solution
Temperature controlConstant 20°C ± 0.5°C bath
Reporting standardASTM D2487 (USCS classification)
Typical turnaround3 to 4 business days

Related services

01

Combined sieve and hydrometer

Complete gradation curve from 75 mm to 0.001 mm using mechanical sieving and hydrometer sedimentation per ASTM D7928.

02

Wash sieve analysis

Quantification of minus No. 200 fraction by wet sieving, essential for Oxnard silty sands that blind dry sieves.

03

Hydrometer-only testing

Fine fraction analysis for clay/silt discrimination when the coarse fraction is minimal, typical in Oxnard Plain basin deposits.

04

Gradation curve interpretation

Calculation of D10, D30, D60, uniformity and curvature coefficients, plus USCS classification per ASTM D2487 with a written summary.

Applicable standards

ASTM D2487 (Unified Soil Classification System), ASTM D7928 (Hydrometer analysis of fine-grained soils), ASTM D6913 (Sieve analysis of soils), ASCE 7-22 (Seismic site classification using gradation data), IBC Chapter 18 (Soils and foundations)

Common questions

What does a grain size analysis cost in Oxnard?

A combined sieve and hydrometer test runs between US$100 and US$210 per sample, depending on the number of sieve sizes requested and whether the hydrometer phase is full or abbreviated. We quote a firm price after seeing the material and discussing the project specification.

Why is the hydrometer test necessary and not just a sieve analysis?

Sieves stop at the No. 200 opening, which is 0.075 mm. Everything passing that is just reported as 'fines.' In Oxnard, those fines can be either rock flour from the Santa Clara River or plastic clay from basin deposits. The hydrometer test measures particle sizes down to about 0.001 mm, giving you the silt versus clay split. That split controls permeability, frost susceptibility, and Atterberg limits correlation.

How long does the hydrometer test take?

The sedimentation phase runs a minimum of 24 hours, with readings at specific time intervals. Including sample preparation, dispersion, and the sieve portion, we typically deliver the full combined report in three to four business days. We can expedite to 48 hours if the project is on a critical path.
Location and service area

We serve projects in Oxnard and surrounding areas. More info.

View larger map