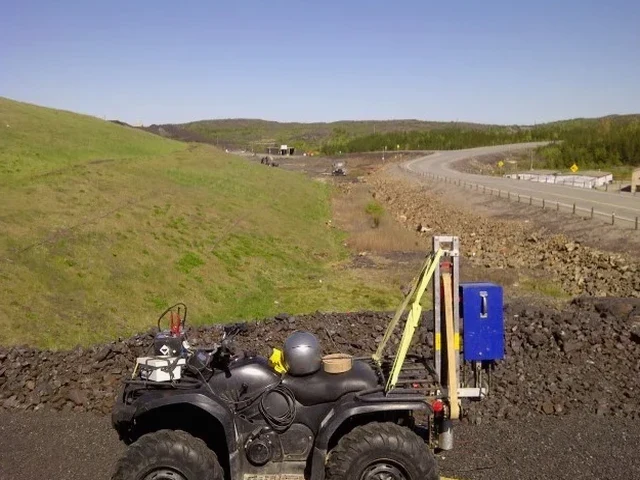
The geophone spread stretches across the agricultural parcel just east of the Santa Clara River—24-channel array, sledgehammer source on a steel plate, cables snaking through strawberry rows. That's the typical field setup for a seismic refraction survey in Oxnard, where the shallow subsurface alternates between recent alluvium, beach sands, and the deeper Pliocene-age Pico Formation. The hammer strike sends a compressional wave racing through loose silty layers at maybe 400 meters per second, then refracting off a stiffer Pleistocene unit where velocity jumps past 1,200. Recording that first-arrival time at each geophone gives us the raw travel-time curve we invert into a velocity cross-section. For deeper targets—say mapping the Oak Ridge Fault zone or imaging basin geometry below the Oxnard Plain—we switch to a reflection acquisition with a 48-channel spread and a weight-drop or accelerated mass source. The reflection method captures acoustic impedance contrasts down to 100 meters or more, producing stacked sections that read like a seismic stratigraphy textbook. Both techniques fall under seismic tomography once we run iterative ray-tracing inversions, building velocity models that geotechnical engineers use to site critical infrastructure, from wastewater treatment expansions to bridge replacements along Highway 1. The coastal setting adds a wrinkle: shallow groundwater, common less than 3 meters below grade across much of Oxnard, boosts P-wave velocity in saturated sands and can mask subtle velocity anomalies unless we process carefully with damped least-squares inversion and proper weathering corrections. When the stratigraphy gets complex—interbedded clays and sands typical of the estuarine deposits underlying the Mandalay Bay area—we often pair seismic velocity data with a CPT test to correlate seismic shear-wave velocity (Vs) directly with tip resistance and pore pressure dissipation, giving the geotechnical model twice the constraint.
Seismic velocity is the one geophysical parameter that feeds directly into both dynamic soil properties and static stiffness models—no empirical conversion needed.
Our approach and scope
Oxnard's built environment didn't really accelerate until the 1940s, when the naval bases at Port Hueneme and Point Mugu drove a housing boom across former lima bean fields. That rapid expansion means much of the city sits on engineered fill placed over compressible Holocene marsh deposits—not exactly ideal conditions for heavy structures without solid subsurface data. Seismic tomography gives us a non-invasive way to map those transitions without punching boreholes every 50 feet. A typical refraction profile here resolves three to four velocity layers: a dry surficial crust (300–600 m/s), saturated alluvium (1,200–1,800 m/s), weathered Pico siltstone (2,000–2,800 m/s), and competent bedrock below 3,000 m/s. The reflection method adds vertical resolution, picking up clay-sand interfaces within the uppermost 30 meters that matter enormously for liquefaction assessments under ASCE 7-22 Chapter 20. Our processing workflow runs first-break picking in the field to catch bad shots early, then iterative tomography with grid-based ray tracing—no layered-model assumptions that break down in the lateral heterogeneity common near the Santa Clara River's paleochannels. We output 2D P-wave and S-wave velocity sections at 0.5-meter vertical resolution in the near-surface, plus Poisson's ratio maps that help identify water-saturated zones versus gas-charged sediments. The technique integrates naturally with geotechnical drilling programs: a seismic line run between two boreholes lets us extrapolate stratigraphy across the site, cutting mobilization costs on large agricultural-to-commercial conversion projects east of Rice Road. For projects requiring shear-wave velocity profiles for site classification (Site Class C through E are typical in Oxnard), we acquire MASW data along the same spread, extracting dispersion curves that invert to Vs30 values required by the California Building Code.
Local geotechnical context
ASCE 7-22 Chapter 21 requires site-specific ground motion procedures for Site Class D and E soils where mapped spectral accelerations exceed certain thresholds—and large portions of Oxnard's coastal corridor fall squarely into that category. The city lies within the Western Transverse Ranges seismic zone, with the San Andreas Fault 60 kilometers to the northeast and the Oak Ridge Fault system running beneath the Oxnard Plain itself. The 1994 Northridge earthquake produced peak ground accelerations exceeding 0.25g at Oxnard recording stations, a reminder that basin-edge effects amplify shaking in the deep alluvial wedge underlying the city. Seismic tomography directly addresses this risk by measuring S-wave velocities in situ, eliminating the reliance on blow-count correlations that break down in the silty fine sands and low-plasticity clays typical of the Oxnard Formation. A Vs30 map generated from a grid of refraction-plus-MASW lines gives the structural engineer defensible Site Class boundaries, not interpolated guesses. For critical facilities—water treatment plants, hospital expansions, the Port of Hueneme logistics infrastructure—we run full reflection grids to identify blind thrust structures within the uppermost 100 meters that could produce differential displacement across a foundation footprint. Skipping this step on a Site Class E parcel north of Channel Islands Boulevard means accepting a design spectral acceleration that may be off by 30% or more, with corresponding consequences for base shear calculations and lateral force-resisting system costs. The California Geological Survey's Seismic Hazards Mapping Program has flagged much of the Oxnard Plain for liquefaction susceptibility; seismic tomography provides the shear-wave velocity data needed to run simplified CPT-based liquefaction triggering procedures with site-specific Vs rather than generic correlations.
Standards that apply
ASCE 7-22 (Minimum Design Loads – Seismic, Chapters 20–21), ASTM D5777-18 (Standard Guide for Seismic Refraction), ASTM D7128-18 (Standard Guide for Seismic Reflection), ASTM D7400-19 (Standard Test Methods for Downhole Seismic Testing), California Building Code 2022 (CBC, Title 24, Part 2 – Chapter 16), IBC 2021 Section 1613 (Earthquake Loads)
Common questions
How much does a seismic refraction survey cost for a typical Oxnard commercial lot?
For a standard 1–2 acre Oxnard commercial parcel with a single refraction spread and MASW profiling, budget roughly US$2,690 to US$5,360 depending on access conditions, line length, and whether we need reflection data for deeper targets. Tight sites with obstructions or heavy crop cover push logistics cost upward. We provide a fixed-price proposal after reviewing your geotechnical scope and site plan—no surprise mobilization charges.
Can seismic tomography detect the Oak Ridge Fault beneath my property?
Reflection seismic with a high-fold CDP survey can image fault offsets on the order of 1–2 meters at depths to 100 meters, which is sufficient to identify Holocene-active strands of the Oak Ridge Fault system where they displace Quaternary reflectors. Refraction alone is less diagnostic for fault mapping because velocity contrasts across a fault zone can be subtle. We typically recommend a combined approach: refraction tomography for the upper 30 meters of site characterization, plus targeted reflection lines oriented perpendicular to known fault traces per the California Geological Survey's fault activity maps. A definitive fault rupture hazard assessment still requires trenching, but seismic data tells you exactly where to dig.
What Vs30 values do you typically measure in Oxnard, and what Site Class does that correspond to?
Across Oxnard's coastal plain we routinely measure Vs30 between 180 and 350 m/s, placing most sites in Site Class D (stiff soil, 180–360 m/s per ASCE 7-22). Areas underlain by thick Holocene marsh deposits—common west of Victoria Avenue near the old McGrath Lake wetlands—can dip into Site Class E (Vs30 below 180 m/s), which carries a significant seismic design penalty. Sites on the Pleistocene terraces near the Santa Clara River's northern bank sometimes reach Site Class C (360–760 m/s) where Pico Formation siltstone sits within 15 meters of grade. We report Vs30 with measurement uncertainty bounds (±15%) so your structural engineer can make informed decisions about whether to use site-specific ground motion procedures or the code-default spectral accelerations.