← Home · Seismic

Soil Liquefaction Analysis in Oxnard: Laboratory Testing and Field Data

Together, we solve the challenges of tomorrow.

LEARN MORE →

The cyclic triaxial system in our Oxnard laboratory runs a confining pressure of 100 kPa and a loading frequency of 1 Hz. That setup replicates the shear stress reversal a saturated sand layer experiences during a moderate to large earthquake. Samples arrive from job sites across Oxnard in thin-walled Shelby tubes, sealed with microcrystalline wax to preserve in-situ moisture. We back-calculate the cyclic stress ratio (CSR) and the cyclic resistance ratio (CRR) for each specimen. The factor of safety against liquefaction comes from that direct ratio. For silty sands typical of the Oxnard Plain, we often combine the triaxial data with a CPT test log to refine the fines content correction. That correction shifts the CRR curve and changes the whole interpretation.

Fines content correction can shift the factor of safety by 0.3 or more in Oxnard's silty alluvium—skipping it is a design error, not a shortcut.

Our approach and scope

A common mistake we see in Oxnard is running a standard SPT blow count and skipping the fines content wash. A contractor gets N1(60) of 12, looks at the simplified procedure chart, and assumes the site is safe. But Oxnard's alluvial deposits near the Santa Clara River carry a silt fraction above 35 percent. That fines content boosts the CRR by up to 40 percent in some layers and masks the true liquefaction susceptibility. Without a sieve analysis on the split spoon sample, the engineer cannot apply the Idriss and Boulanger (2008) magnitude scaling factor correctly. The lab protocol here starts with ASTM D2487 classification. We split every disturbed sample. Half goes to grain size. Half goes to Atterberg limits if the material passes the #40 sieve. Only then do we input the corrected blow count into the liquefaction triggering spreadsheet.
Soil Liquefaction Analysis in Oxnard: Laboratory Testing and Field Data
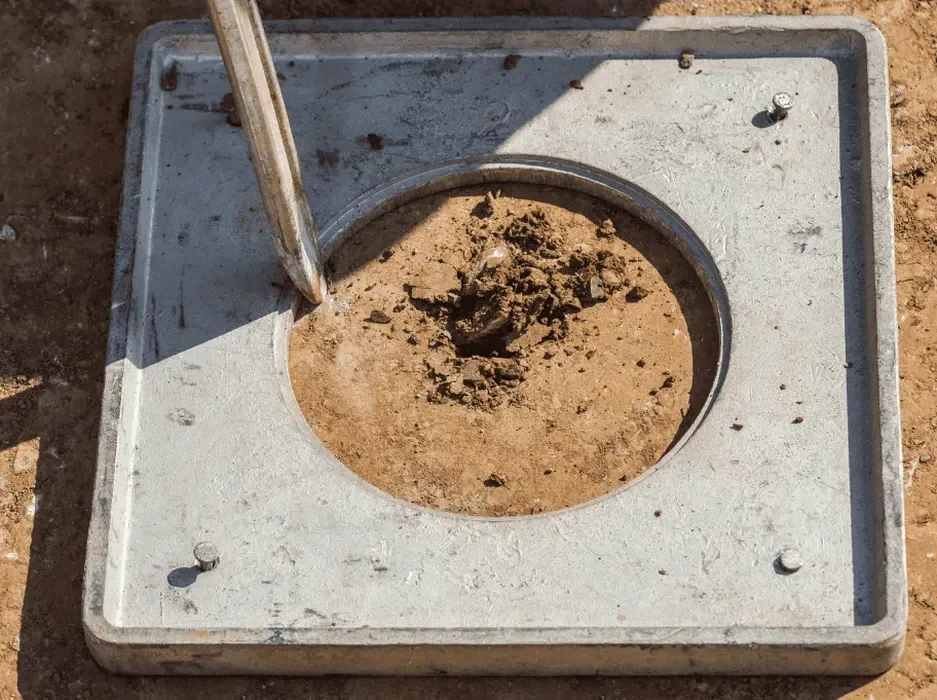
Technical reference image — Oxnard

Local geotechnical context

The Oxnard Shores neighborhood sits on loose, young beach and dune sands mapped as Holocene deposits. Groundwater depth there is often less than 3 meters. Two miles inland, the La Colonia area rests on older alluvial terraces with a shallow clay cap. The contrast is stark. Shores reaches a liquefaction potential index (LPI) above 15 in a scenario earthquake. La Colonia might stay below LPI of 5 for the same shaking. But that clay cap introduces a different hazard: cyclic softening. We treat that separately from flow liquefaction. The lab runs undrained cyclic triaxial tests on the clay cap material. If the cyclic strain exceeds 3 percent in 15 uniform cycles, we flag the layer as susceptible to strength loss. Post-liquefaction settlement estimates follow the Zhang et al. (2002) method. Volumetric strain correlates to the factor of safety and the corrected SPT or CPT tip resistance.

Need a geotechnical assessment?

Reply within 24h.

Email: info@geotechnicalengineering1.com

Watch the video

Typical values

ParameterTypical value
Test standardASTM D5311 / ASTM D3999 for cyclic triaxial
In-situ correlationSPT N1(60) via ASTM D1586, CPT qt via ASTM D5778
Fines content thresholdFC > 35% triggers Idriss-Boulanger correction in Oxnard silts
Cyclic stress ratio (CSR)Seed-Idriss simplified procedure, Mw 7.5 reference
Sample preservationShelby tubes, wax-sealed, transported at field moisture
Design code referenceASCE 7-22 Chapter 21, IBC Section 1803.5
Factor of safety targetFS ≥ 1.2 for level ground, FS ≥ 1.1 for near-slope conditions

Related services

01

SPT-Based Liquefaction Triggering

We process field SPT data with hammer energy correction (ER=60%), borehole diameter correction, and rod length correction. The lab runs grain size distribution and Atterberg limits on each split spoon sample. The output is a layer-by-layer factor of safety table and a liquefaction potential index map for the site.

02

Cyclic Triaxial Testing Program

Undisturbed samples are extruded, trimmed to 71 mm diameter, and saturated under backpressure until a B-value above 0.96 is achieved. We apply a sinusoidal axial load at 1 Hz and record pore pressure buildup. The test generates cyclic resistance curves for 15 uniform cycles at 5% double-amplitude axial strain.

03

CPT-Based Screening with Soil Behavior Type

We correlate CPT tip resistance and sleeve friction to the Robertson (2009) soil behavior type chart. The normalized cone resistance (Qt) and normalized friction ratio (Fr) feed directly into the Boulanger and Idriss (2014) liquefaction triggering procedure. This service works best for deep alluvial profiles where undisturbed sampling is difficult.

Applicable standards

ASTM D5311 Standard Test Method for Load Controlled Cyclic Triaxial Strength of Soil, ASCE 7-22 Minimum Design Loads and Associated Criteria for Buildings and Other Structures, IBC Section 1803.5 Geotechnical Investigation Requirements for Seismic Design, ASTM D1586 Standard Test Method for Standard Penetration Test (SPT) and Split-Barrel Sampling of Soils

Common questions

What is the approximate cost of a soil liquefaction analysis in Oxnard?

The cost ranges from US$2,340 to US$3,760 depending on the number of samples, the testing method (SPT-based vs. cyclic triaxial), and the depth of the critical layers. A typical project with four SPT samples and full grain size classification falls in the middle of that range.

How deep do you need to investigate for liquefaction in Oxnard?

We follow ASCE 7-22 guidelines, which require investigation to a depth where liquefiable soils are no longer present or to 15 meters below the groundwater table, whichever is deeper. In Oxnard's coastal areas, the critical zone is usually the upper 12 meters. The groundwater table is measured in the field with a standpipe piezometer before sampling begins.

Can you analyze liquefaction risk from existing boring logs?

Yes, if the logs include SPT blow counts, hammer type, and sample recovery data, we can perform a desktop analysis. We still need a representative soil sample for fines content and plasticity index testing in our Oxnard lab. Without the fines content data, the analysis is incomplete per the Idriss and Boulanger method.

What is the difference between flow liquefaction and cyclic mobility?

Flow liquefaction occurs when the in-situ shear stress exceeds the residual shear strength of the liquefied soil, causing large, rapid deformations. Cyclic mobility develops incrementally during shaking without a complete strength loss. Our lab evaluates both mechanisms: flow liquefaction through monotonic undrained triaxial tests, and cyclic mobility through the cyclic triaxial program with pore pressure monitoring.
Location and service area

We serve projects in Oxnard and surrounding areas.

View larger map